
intra

Intra was a series of quantified self projects.
The project began after I started time-tracking when I noticed patterns in creative output and wondered what factors had an impact on those, so I tracked things like what I ate, how much sleep I had, and even daily weather conditions.
Since then I’ve just been collecting data. Over time, I hope to have enough to see patterns emerge and maybe even forecast future creative output given these factors.
The goal is to turn data into information,
and information into insight.—
Carly Fiorina
Update: I stopped tracking these metrics in .
system

Tracking was done manually, aided by scripts, and data was stored in plaintext. I created small tools for things like summary statistics and data visualisation.
| dataset | metric | type |
|---|---|---|
| drink | rating | ordinal, 1–5 scale |
| amount | numerical, milliliters as base unit | |
| type | description of drink | |
| food | rating | ordinal, 1–5 scale |
| type | description, a list of consumed food items | |
| mood | rating | ordinal, 1–5 scale (💀 🙁 😐 🙂 😀) |
| amount | numerical, milliliters as base unit | |
| sleep | rating | ordinal, 1–5 scale |
| span | date range, estimated start and end of sleep session | |
| medical | event | description, ailment |
| energy | rating | ordinal, 1–5 scale |
| morale | rating | ordinal, 1–5 scale |
eau
I tracked what I drink. Each entry consisted of a timestamp, a 1–5 scale of how much I liked that drink, the amount (in mL), and what it was. From these, I can gauge things like hydration levels and caffeine intake.
| timestamp | rating | amount | drink |
|---|---|---|---|
| 4 | 500 | tea |
food
I tracked what I eat. Initially I included calorie counts, nutritional information, servings/weight, but that got really tedious. Eventually I just stuck to listing food ratings and the food items and/or ingredients.
Apps like Samsung Health lets you track all of the aforementioned but their database is somewhat incomplete or even inaccurate at times. There are no fields for B-vitamins, for example. I find myself often creating custom food items and manually keying in nutritional info based on what’s listed on the package. Another thing I noticed is that countries have different recommended daily intakes and thus list different vitamins and nutrients. Ultimately, it’s not worth the trouble.
| timestamp | rating | food |
|---|---|---|
| 4 | arugula salad, açaí bowl |
med
I tracked instances of illnesses and any other health-related events. This data let me see things like my recovery rate from a bout of bronchitis via the amount of coughs, and patterns in seasonal allergies via sneezes. Cross-referenced with other datasets, I could also see if certain things make me sick.
| timestamp | event |
|---|---|
| nausea |
mood
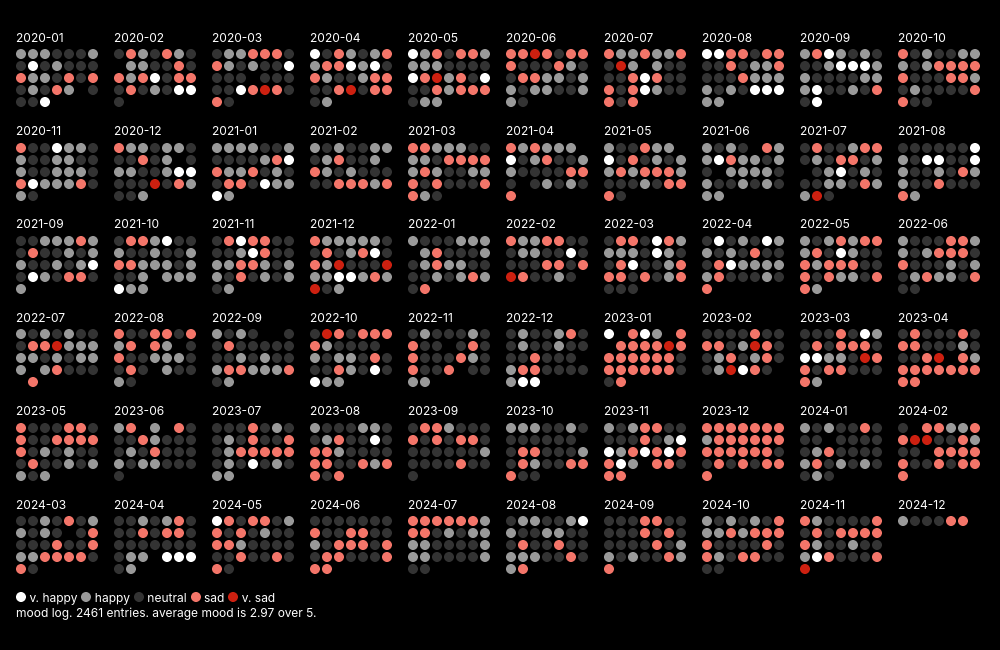
I tracked mood with a 1–5 scale:
💀 🙁 😐 🙂 😀somnus

I tracked sleep — duration and an integer value on a 1–5 scale gauging sleep quality.
| sleep | wake | rating |
|---|---|---|
| 3 |
else
Other things I tracked at some point:
- what I wore every day (stopped)
- lapses in memory, moments of serendipity, moments of déjà vu
- dreams — I still track these but rarely as the amount of detail I can remember upon waking is linked to sleep duration and quality; some of my art are based on dream elements
- workouts, cycling*, walks, jogs, etc. tracked by Samsung Health
- morale and energy levels (both as 1–5 scales), which are a recent addition to the mood logs to add some dimensionality
- personal finances
- media consumption, everything from articles and books read, games played, podcasts and music listened to, films watched
- an inventory of things I own
- memories and notable events through journaling and photography
links
- Quantified Self
- The Personal Analytics of My Life by Wolfram
- unquantified by
Nathan Toups